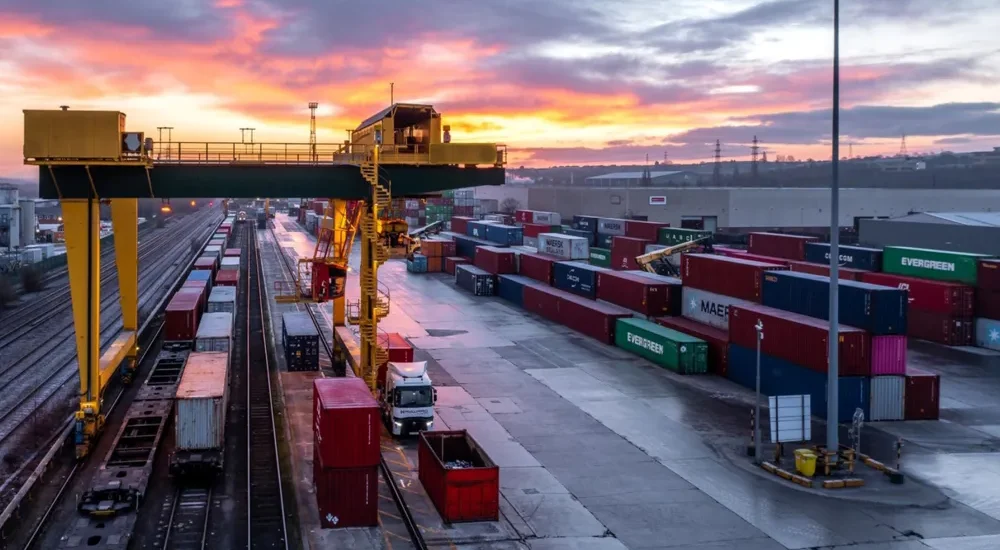
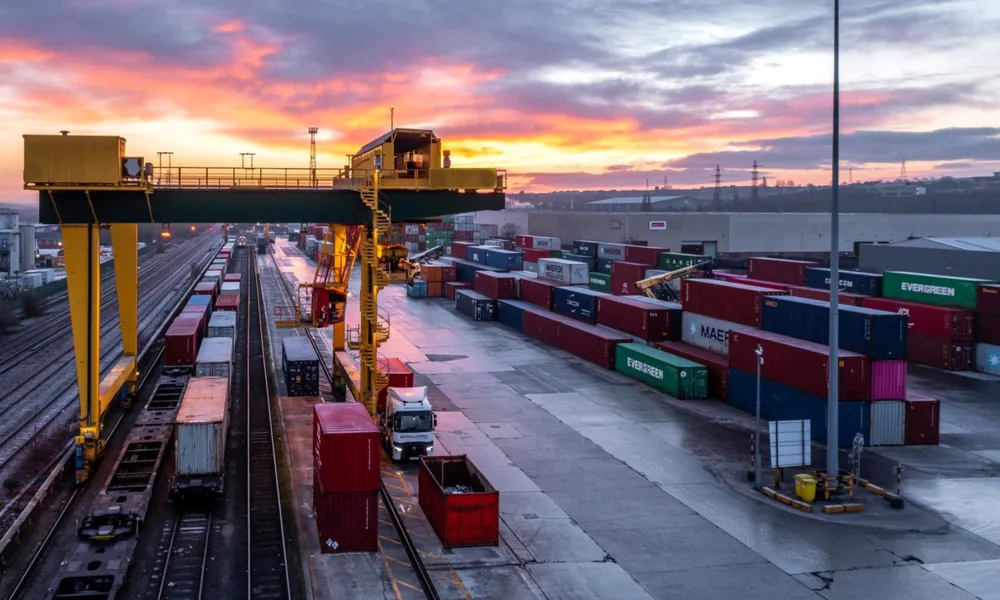
I have written many articles about planning, strategic planning, urban development, urban design, politics of planning, and now it’s time to evaluate urban planning. In this article, I go through the application for the development of the former Parkside Colliery, located on the south-eastern edge of Newton-le-Willows, approximately 1 km north of Winwick in the Warrington administrative area, and 1.5 km southwest of Golborne, in the Wigan administrative area. It is located in the St Helens Green Belt, linking the Green Belts of Wigan and Warrington.
Size is a statutory threshold. The first issue is how the planning application moves towards approval. According to the Planning Act 2008, any strategic and significant development meeting a size threshold follows the Secretary of State application route. Otherwise, in ordinary cases, the application goes through ordinary local planning under the Town and Country Planning Act. (Since the application was in 2006, it took the same route).
Location: The Local Development Framework Core Strategy Background Paper, Parkside Rail Freight Interchange (February 2010), identifies the site boundaries. The site is surrounded by infrastructure networks: the Newton-le-Willows rail line, M6, A49, and the Parkside link road. Workers and visitors have to cross these network connections, whether by car or by other means of transport. Walking to the site is risky; reaching the site by car is also difficult because the highway and rail track are cut off from adjacent development.
People cannot reach other functions, such as countryside parks and recreation parks, on foot or by bike. Recreation route design and implementation become very hard because of the danger of crossing these network connections.
Developing Newton-le-Willows rail station will bring no benefit, because new bus lines would need to be established and the car park already serves the small housing area. Adding 10000 (as per the application) workers would need a massive car park service area and land.
The developer states that it is axiomatic that ready access to primary road and rail routes is an essential component of a successful rail freight interchange. Location is of paramount importance, and the developer lists text from these documents:
North West Regional Spatial Strategy (RSS to 2021), North West Regional Freight Strategy (2003/2004), North West Development Agency: Strategic Regional Sites Designation, The Mersey Partnership Action Plan, The Liverpool City Region in the Northern Way (Sub-Regional Strategy), Merseyside Local Transport Plan (LTP2 Core Document), West Coast Main Line Strategy (Strategic Rail Authority), Merseyside Green Belt Study for North West Regional Assembly, St Helens Council LDF: Issues & Options Paper.
Anyone who does not mind reading 900–1,000 pages of circled text and paragraphs will find them mainly copied from, or agreeing with, official government documents. These documents present a common goal, which can be summarised as follows:
The strategies collectively support a genuine, strategically located rail–road freight interchange in the Liverpool–Warrington–Manchester corridor to increase freight capacity, improve regional connectivity, enable a shift from road to rail, and strengthen economic competitiveness.
The development location is connected to the main ports of Liverpool, Salford, and Garston by the rail line crossing Newton-le-Willows rail station and bordering the site. It is connected to water transport nodes and rail transport nodes that connect it to Liverpool and Manchester. That is the case without much effort in reading, analyzing, and presenting evidence, using just basic knowledge of planning. The developer and applicant just copied and inserted all the published strategies of local authorities, government publications, and a few private firms’ studies. So what to evaluate?
The Need: In his application, the developer indicates an increase in freight movement by trucks, reaching 266 million tons per annum. He also indicates increased road congestion and related air pollution and noise. The increased demand for truck drivers, and the shortage of available drivers, has become an obstacle to moving containers by truck. The increase in the cost per ton-mile of movement is another obstacle.
In one of the need study reports, he cites the statement by the SRA (Strategic Rail Authority) on Strategic RFIs in the North West:
“In order to deliver sustainable freight distribution, it is clear additional SRFI capacity is required in the NW region. The SRA’s stated position is that the most efficient use of the WCML, and the rest of the network in the area, would be made by those projects located within the Liverpool-Warrington-Manchester commercial belt to the south of the NW region.”
The official authority has stated the need and indicated the exact location, and the developer is repeating the same text from the authority’s publications.
A planner in the UK can check the cost of freight movement by truck because the figures are available and include insurance, fuel, tyres, and other costs. For rail, the equivalent cost per mile, including insurance, is not available at all in the UK. So a planner needs to obtain a quote at the time of the application, provided the origin and destination of the freight movement are known.
If there is no available data to check against the mega development from an official source, then what to evaluate?
Table 1, comparative cost of freight movement by truck vs rail (USA figures)
| Cost / Operating Factor | Freight Trucking | Freight Rail |
| Average Private Cost | ~15.6¢ per ton-mile | ~5.1¢ per ton-mile |
| Insurance Cost Drivers | High (8% of operational costs due to highway accident/theft risk) | Low (Contained within private track infrastructure costs) |
| Fuel Efficiency | Lower (~145 ton-miles per gallon) | High (Up to 4 times more fuel-efficient than trucks) |
| External Costs (Pollution/Noise/Accidents) | 1.11¢ per ton-mile (Not fully passed to consumers) | 0.24¢ to 0.25¢ per ton-mile |
| Capacity Ratio | 1 Truckload max capacity (~25 tons) | 1 Railcar = 4 Truckloads (1:4 ratio) |
Development functions: The development proposal includes industrial land use (715,000 sq m of rail-served warehouse and distribution buildings). Commercial – office land use (18,600 sq m of development-related Business Centre (B1 office space)). Retail land use (9,300 sq m, Park Centre). Recreation land use (a Countryside Park). Services land use (power-generating facilities, including 1,850 sq m of ancillary buildings). Infrastructure (developing a train station and providing parking).
The developer submitted several studies with the coalition in regard to the development functions. All the focus was on the rail and warehouse facilities and storage. That is apparent in the process used to select the site for this function from the 72 other locations. The criteria used to select the site for this function are shown in Table 2. For example, the site area must be greater than 40 ha, have a W8 loading gauge, an existing rail connection, RA9 axle load capacity, and be within 5 miles of a highway. All these criteria are linked to the rail facility, warehousing, and storage.
Table 2, site selection criteria for the rail, warehouses, and storage facilities.
| Criteria | Number of sites meeting or exceeding criteria |
| Rail/road intersection and/or strategic development site | 72 |
| Site within 5 miles by road to nearest motorway | 64 |
| Site with at least RA9 axle load capacity on adjacent main line | 48 |
| Site equal to or greater than 40 Ha. | 57 |
| Site with at least W8 loading gauge on adjacent main line | 35 |
| Site with existing rail access | 18 |
| Sites with NWDA Strategic Regional Site status (April 2005) | 4 |
| Sites meeting all the above criteria | 2 |
The other functions the developer proposed were not selected on the basis of land use modelling. Mixing these land uses together is not correct design practice. Designating a countryside park in this development is not correct. The application does not show any modelling for this type of land use, nor do the submitted studies. For a park land use, the criteria include:
Environmental constraints (exclusion layers): protected/heritage areas, waterbodies/wetlands/river corridors, flood-risk zones, steep slopes (where relevant), and any legally or policy-restricted land.
Park ecological suitability (drivers): existing vegetation/land cover quality, proximity to existing habitats/green corridors, habitat connectivity potential.
Topography/landform: slope, elevation/terrain roughness (affects habitat creation and development feasibility).
Soils/land quality: soil type/drainage potential (if available) to support maintenance/planting and manage runoff.
Accessibility & human-use suitability (if planning assumes public access): proximity to roads/paths, public transport, settlement edge density (used as surrogate socioeconomic factors to represent demand/attractiveness), plus avoidance near incompatible uses.
Urban development pressure (for displacement/projection): distance to existing urban/land-use classes, growth “attractors” (roads, services), and policies/zoning proxies.
The most important criterion is the distance from urban areas. In order to make this function feasible, the countryside park should meet various urban design requirements such as urban density (you can read my detailed article covering this topic). And from my experience in the field, this function does not fulfil the requirements because it has to be within a 15-minute walk of urban areas. The only area that meets this requirement is Newton-le-Willows; see Table 3, which shows the distance from the site to urban areas adjacent to it.
Table 3, walking distance from the development site (in minutes)
| Area – Council | Distance to the development site/minutes |
| Newton-le-Willows | 15 minutes |
| Warrington Town Centre | 1 Hour 41 minutes |
| St Helens Town Centre | 2 hours 22 minutes |
| Wigan Town Centre | 3 hours 2 minutes |
I did not find any mention of land use modelling methods in the development plan. This also includes all the studies submitted with the development application. I searched the documents for a few land use modelling methods, but none were present. See Table 4 for land use modelling methods used in urban planning.
Table 4, land use modelling methods used in urban planning
| Method | Source |
| Cellular Automata (CA) land-use simulation (scenario/pattern generation) | C. Lau (2002) “A cellular automation model for urban land use simulation” (local rules using accessibility, density, property value; includes “attribute effect” vs “gravity/inertia effect”). |
| Agent-Based Models (ABM) / microsimulation with explicit agents (households/firms/developers) | Bouanan et al. (2018) “Agent-based modelling of urban land-use development…” (dynamic bottom-up location choice by households and economic activities). Barramou & Addou (2012) (ABM coupled with GIS for land-use planning). |
| System Dynamics (SD) / high-level strategic land-use–transport interaction models | Pfaffenbichler et al. (2010) “A system dynamics approach… MARS” (strategic high-level model, designed to be transferable and communicable to decision makers). |
| Hybrid SD–ABM–CA (decision-support / multi-scale integration) | Liu et al. (2020) “LandSDS…” (seamless integration using SD + ABM + CA controlled through GIS). |
If land use modelling was very basic and concentrated on rail, warehouses, and storage, and no methods were used, then what to evaluate?
Job creation: The developer’s job figure comes from floorspace by function, not from a study of the labour market. The statement applies one job per 93 sq m of warehousing and four per 93 sq m of office. That gives about 7,700 warehouse jobs and 800 office jobs. Its staffing profile then allocates 10,000 jobs by function: 8,500 in the rail-linked warehouses, 1,000 in the Business Centre, 200 in secure freight distribution, 110 in the intermodal terminals, 150 in the Park Centre and 40 in train assembly and site management. These are gross jobs created by the buildings, and they say nothing about who will fill them. The table below shows who was in the local labour market in 2016: about 360,600 economically active residents in Wigan, Warrington and St Helens, of whom 17,900 (5.0%) were unemployed. In number alone, the unemployed could fill the scheme, since 17,900 is 1.8 times the 10,000 jobs. But the relevant pool is the unemployed with logistics or warehouse experience, and that number is not given in the application documents or in the data available to this evaluation. If 5% to 15% of the unemployed had that experience, which is an assumption and not a finding, the pool would be roughly 900 to 2,700 people, a fraction of the 8,500 warehouse jobs.
The statement’s claim that the scheme will help address local employment-related deprivation, and that its labour force is skilled for logistics, is therefore not demonstrated. Its labour market assessment counts working-age residents within a 30-minute drive (over 1.5 million), people with process, plant and machine-operative skills (well over 100,000) and the share of lower-skilled workers. It does not count unemployed people with logistics experience, and no commitment requires occupiers to recruit locally. The planning policies the developer relies on make this evidence necessary. Regional Policy EC7 requires warehousing and distribution sites to take account of proximity to an appropriate labour supply, and the SRA/DfT criteria quoted in the Alternative Sites Report treat an available and economic workforce as a determining factor in siting. Both are location tests, which need the labour supply to be shown with data relevant to logistics, not asserted from catchment totals. A site chosen because a workforce is already available is also a different claim from a scheme that creates jobs for residents who lack them. Finally, St Helens’ jobs density of 0.62 against 0.85 nationally in 2016 equates to a gap of about 25,000 jobs. Even if all 10,000 gross jobs were in St Helens, which they would not be, since the site straddles two boroughs, they would close about 40% of it. See Table 5, Workforce and unemployment, 2016.
Table 5, Workforce and unemployment, 2016.
| Area | Economically active | In work | Unemployed | Unemployment rate | Unemployed as % of the 10,000 jobs |
| Wigan | 162,100 | 154,100 | 8,000 | 4.9% | 80% |
| Warrington | 109,700 | 105,400 | 4,300 | 3.9% | 43% |
| St Helens | 88,800 | 83,200 | 5,600 | 6.3% | 56% |
| Total | 360,600 | 342,700 | 17,900 | 5.0% (pooled) | 179% |
Land ownership: Control of land is one of the strongest determinants of whether a large scheme is delivered, and Parkside’s land position was an advantage for its promoters. The core colliery site passed from the Coal Board to Railtrack, and then Network Rail, so much of the land sat with a single institutional owner willing to sell, and in October 2005 Network Rail decided to sell to Astral. The Alternative Sites Report also counts availability for immediate development among Parkside’s strengths. The rest of the land was held by ten other owners named on the 2006 certificate: two public bodies (the Coal Authority and the Secretary of State for Transport, for the M6 and Junction 22), two companies, the trustees of the Legh Estate with two tenant farmers, an owner represented by an agent, and four households whose properties appear on the form’s demolition list. Astral described itself in October 2006 as part owner and part prospective purchaser, so assembly was not complete. See Table 6, land owners of development parcels.
Table 6, land owners of development parcels
| # | Owner | Type | Land or interest shown | Position at 18 October 2006 |
| 1 | Network Rail | Rail infrastructure company (successor to Railtrack) | The colliery site, bought by Railtrack from the Coal Board (statement history) | Decision to sell to Astral taken in October 2005, yet still listed as owner on 18 October 2006, so the sale was probably not completed (inference) |
| 2 | The Coal Authority | Government body | Not described on the sheet; probably mineral interests (inference) | Notice served; no purchase stated |
| 3 | Secretary of State for Transport (c/o Highways Agency) | Government | Not described; probably M6 and Junction 22 land (inference) | Notice served; the scheme relocates M6 Junction 22, so land or rights would be needed (inference) |
| 4 | Interland UK Ltd | Private company | Not described | Notice served; may be among the land Astral was to buy (not stated) |
| 5 | FB Cooper (Woodhead) Ltd | Private company | Woodhead Farm, Winwick (notice address) | Notice served |
| 6 | Owner represented by Mr P A E Johnson, Frank R Marshall & Co | Private; owner’s name not given | Not described | Notice served on the representative |
| 7 | Trustees of the Legh (1994) Trust and Legh Estate (c/o Ingham & Yorke) | Private estate | Farmland let to two tenant farmers: Mr Bullmer (Kenyon Hall Farm) and Mr Hubbant (Sandup Farm) | Notice served on the owners and on both tenants (Agricultural Holdings Certificate) |
| 8 | Mr G and Mrs H Cooper | Private household | Parkside Farm, Parkside Road | Parkside Farm is on the demolition list (matched by address) |
| 9 | Mr and Mrs S Coogan | Private household | Barrowcliffe Cottage, Parkside Road | Barrowcliffe Cottage is on the demolition list (matched by address) |
| 10 | Mrs C Mondo | Private household | The Stables, Parkside Road | The Stables is on the demolition list (matched by address) |
| 11 | Mr and Mrs K Mills | Private household | Rough Cottage, Winwick Lane (correspondence to a Dorset address) | Rough Farm and Cottage on Winwick Lane is on the demolition list (matched by address) |
For this development, the land ownership was in hand from the beginning of the proposal, and neither the developer nor the government faced any resistance from owners of the parcels. There were no political or private conflicts, so what to evaluate?
Existing rail freight development: In reading the developer’s document and proposal, he mentions the high demand for freight interchange development. The document presents a forecast of demand for the next 10 years (from 2006 to 2015) of 10 million tons of container movements within the area.
Retailers and large-scale businesses such as Asda, Tesco and Aldi will surely want to reduce the cost of moving their products within the UK and to the UK. So why would a retailer add cost by storing their products in the warehouses at Parkside? The safest way to reduce cost is to bring the freight by train to the rail station nearest to the retailer’s stores. From there, the retailer transfers the products to the stores. That is logical, and anyone with common sense will think of that. From reading the study and the developer’s document, the developer indicates that Parkside is the largest area for logistics work and movement in England, which is documented as true.
But other areas also have storage capacity, since this is the largest zone for logistics movement, so this development is unnecessary. One of the studies available as a reference for the freight rail demand indicates that there are competitors for this location.
The argument that neighbouring areas already have rail terminals and storage, so that Parkside is unnecessary, rests on facts that are partly sound, but it reaches a conclusion the evidence does not support. The council’s own 2016 study confirms a competitive field: Ditton is operating, with five to six daily trains and more than 120,000 containers a year, and is planned to grow to up to 16 trains a day in each direction. Trafford Park is established, Port Salford is under construction with a similar design capacity, Knowsley is being refurbished, and Garston can receive trains only from the south. The study even accepts that Liverpool traffic is unlikely to come to Parkside because of Port Salford. See Table 7: comparison of old and new rail freight development.
Table 7 – Comparison of current/potential maximum capacity (number of trains) at other sites (existing and planned) in the catchment area
| Site | Status | County Name and Region | Number of trains | ||
| Current | Potential Maximum | Potential Additional | |||
| Parkside | Proposed | Merseyside, North West | 0 | 12 | 3 (small) /8 (medium) /12 (large) |
| Ditton | Existing | Cheshire, North West | 6 | 16 | 10 |
| Knowsley | Being refurbished | Merseyside, North West | 0 | 2 | 2 (*) |
| Seaforth | Proposed | Merseyside | 0 | 15 | 15 (*) |
| Port Warrington | Proposed | Cheshire | 0 | 2 | 2 (*) |
| Port Cheshire (EP) | Proposed | Cheshire | 0 | 2 | 2 (*) |
| Four Ashes | Proposed | Staffordshire | N/A – Not in catchment area | ||
| Port Salford | Under construction | Greater Manchester | 0 | 10 | 5 (*) 5 |
| Garston | Existing | Merseyside | 4 | 4 | 0 |
| Trafford Park | Existing | Greater Manchester | 15 | 15 | 0 |
The developer’s defence of the development proposal is the forecast that indicates an increase in demand for freight movement in 2015 of 10m tons a year. This table shows that the demand and the study indicated that it is covered by the existing projects. The only factor that the developer has in favour of the application is that the development can receive trains from different directions. So, if the demand is covered until 2015, what to evaluate?
The developer finally did not have any strong grounds for his submission, but only the collection of goods from different directions. The development proposal benefits have some doubts in many areas. One additional credit is that it follows the government strategies and development plans for freight interchange development. The developer wasted lots of effort and consumed the officials’ time in reviewing the proposal.
References:
Development, A. (2006). Parkside Strategic Rail Freight Interchange (p. 415). Astral development. (Development application 2006 and all study reports)
CO, A. (2016). Parkside Logistics and Rail Freight Interchange Study (p.134). ST. Helen Council.