The developer sat in the meeting with all the architects, urban designers, external consultants, the project management company, and the client representative. The conversation became heated because of how strictly the government limited the amount of development allowed on the land. The discussion circled around the number of buildings a developer can build under the country’s rules. Then the developer asked, “How many units are we allowed to build?”
Anyone working with him understands what the question really means: how much he stands to gain from the units he builds. In my experience working on various developments, the concern goes much deeper than that. Many developments reach a peak and then halt because of cash flow, and I worked on one of them. The main factor a developer focuses on is the funding of the development, which for mega projects reaches billions of dollars.
The developer’s question, how many units we are allowed to build, relates directly to urban density. Urban density is seen from different perspectives, used by different professionals, and applied in different contexts. In the vocabulary of design professionals, urban density is an integral part of daily work. It includes measures such as density indexes (for example, the number of people per hectare and the number of dwelling units per acre of land) and related measures of land use intensity, such as coverage and floor area ratios. These concepts are used by architects, municipal engineers, land use planners, and urban designers, and they affect applications ranging from the design of housing clusters to the zoning standards of entire cities.
When these professionals apply urban density measures, they change or influence the urban form of the built environment. Why do professionals keep returning to urban density? At the developer’s request, the architect negotiates for the maximum housing mix for the development. The urban planner uses density to submit a zoning modification to the planning commission for approval. The engineer calibrates a land use model to project sewer capacities for the year 2020. The urban designer sketches the layout of a neighborhood center. All of them use urban density as a proxy to achieve something in the real-world environment of the city, suburb, or countryside. Table 1 summarizes how the planner, developer, urban designer, and government each approach it.
Table 1 How the planner, developer, urban designer, and government approach urban density
| Planner | Developer | Urban designer | Government | |
| Density is… | A policy tool to shape the city | A financial input to the project budget | A spatial experience | A public-interest, budget, and political decision |
| First thought on hearing “urban density” | Infrastructure capacity | Viability and return | Quality of place | Public interest and constraints |
| Main question | Can the area support more people? | How many units can I build, and does the math work? | What will it look and feel like to live there? | What does it cost, who benefits, and who objects? |
| Key measure | Units or people per hectare | FAR and sellable floor area | Form, scale, and street quality | Housing supply, service cost, and revenue |
| Biggest worry | Overloaded infrastructure | Approval limits and density caps | Dense but lifeless, hostile places | Public objection and political risk |
In architectural design, urban and regional planning, municipal engineering, infrastructure design, land use planning, and urban design, density measures are used constantly. Yet few of their many users have a sound understanding of what they truly mean. Although there is a fair body of research on densities, building intensity, and density measures (reviewed below), there is little convergence among these studies and even less diffusion of their results.
So What Is Urban Density?
In academic literature, urban density is generally defined as the amount of a specified urban “mass” per unit of area—for example, residents per land area, dwellings per area, or building floorspace per area (Batty, 2009).
A narrower, commonly used city-level definition is total population divided by total city area (Angel et al., 2021). But scholars caution that “urban density” is not one uniform measure: its meaning depends on what is counted, the boundary and scale of the area, and whether the denominator is gross or net land area (Batty, 2009; Churchman, 1999). The literature also treats density more broadly through measures of buildings, people, jobs, floorspace, and open space, and distinguishes measured from perceived density (Dovey & Pafka, 2013).
| Concise Academic-Style Definition: Urban density is the quantity of a specified urban element—such as population, dwellings, buildings, or floorspace—per unit of a defined urban area; its reported value depends on the element, spatial boundary, scale, and area convention used. (Batty, 2009; Churchman, 1999) |
Urban density is related to many internal cognitive factors, which are included in physical density. Physical density is made up of the objective, physical characteristics of the built environment and its users that contribute to the density people perceive in an actual setting. Some of these characteristics are attributes of the built environment that density measures do not include. These more qualitative factors form what is called “qualitative density,” one component of physical density; the other component is “measured density.”
This “qualitative” part of physical density expresses attributes of structures and buildings such as height and relative spacing (these can be expressed as light, sun, or shadow angles, which conventional density measures fail to include; De Chiara & Koppelman, 1982), massing, juxtaposition (for example, the openness or closure of a site layout), and diversity. Other qualitative factors related to physical density are the character of buildings (for example, the intricacy of their elevations and materials, and the diversity or homogeneity of color), lighting levels, and landscaping.
The “bounding” of an area may also be an important factor. It depends on whether adjacent alternative locations are available for nonresidential uses (shops, streets, pubs, and so on), on the presence or absence of nonresidential land uses, and on their mixture (Rapoport, 1975, p. 139). Another aspect of “bounding” that may contribute to physical density is scale: the sheer extent of an area of homogeneous development and the scale of construction within it. This aspect of density is often neglected (Boudon, 1981), but planners and designers ignore it at their peril.
Other characteristics are expressed in the component of physical density called “measured density.” These more quantitative attributes of the built environment include the number of potential occupants or users in an area, the number of dwellings in an area, and the proportion of a site that is built upon.
In professional practice, these factors include BUA (built-up area), which is the built area on all floors of a building, excluding services. It is important because it relates to construction cost and, if the developer intends to sell the units, to sales revenue. The FAR (floor area ratio) also relates to the development of a building. It is the number that specifies the amount of BUA allowed on a parcel. For example, if a plot has an area of 1,000 sqm and the FAR is 3, the developer is allowed to build 3 × 1,000 = 3,000 sqm of BUA, spread across the floors of a multi-story building. Another factor is allowable height, the maximum height set for the plot parcel, which the developer cannot exceed when the architect designs the building.
Setback is another factor. It defines how far the building must sit back from the plot boundary. In the Middle East, most plots with a 30 m frontage allow developers to build up to the plot boundary at the front and back. On the two sides, a setback of 6 m from the plot boundary is required. Plot coverage is the share of the plot that remains buildable after the setbacks are deducted, normally expressed as a percentage, such as 75%.
This chain of factors determines the urban density, which is why it matters in many ways to the developer, the government, the urban designer, and the architect. Urban density types in various contexts are compared in Table 2.
Table 2 Urban density measures in the USA, EU, and Asia
| USA | EU | Asia | |
| Common unit | People per square mile; dwelling units per acre | People per km²; dwellings per hectare | People per km²; floor area per plot (plot ratio) |
| How “urban” is defined | Census Bureau urban areas, built from small census blocks using population and housing-unit thresholds | Degree of Urbanisation: 1 km² grid cells with a minimum density and a minimum total population | Varies by country: Japan’s Densely Inhabited Districts, India’s census towns, China’s administrative and built-up definitions |
| Main planning tools | Units per acre, minimum lot size, FAR, lot coverage | Dwellings per hectare (UK); site coverage and floor-area ratios (Germany) | Plot ratio and gross floor area, especially in Hong Kong and Singapore |
| What it emphasizes | Horizontal spread and lot rules | Compact form and commuting areas | Vertical density and floor area |
| Typical pattern | Low density, car-oriented, with a few very dense cores | Compact historic cores, mid-rise, strong transit | Very high density, with high-rise in some cities and extreme crowding in others |
Urban Density Relations within an Urban Development
Within a development, a government official or an urban designer working on behalf of a developer prepares the urban design guidelines. Urban density is the product of various studies. Transport planning (for more details, see my article) is directly connected to urban density when planning a new development. When the planner studies the plot to define the internal road network and its connections to the external network, urban density is a key consideration because of its direct impact on road sizes, routes, the types of public transport to plan, and the related stops and their characteristics.
In my previous work on mega projects in the Middle East, I reviewed many submittals, such as traffic impact studies. Transport modeling (for more details, see my article) is mandatory, and the consultant in charge must submit a traffic impact study to the authorities for approval. All buildings in the proposed urban design, regardless of function (residential, office, commercial, or recreational), generate trips. These trips affect the road design of the internal network and its external connections. In addition, the consultant provides parking for the development according to the municipality’s rules.
Urban density is tied to sustainability regardless of the country’s rules. Sustainable urban development and green architecture have their own codes, which award points to the developer or architect. For example, in LEED v4 Neighborhood Development (the USGBC document updated July 2, 2018), Compact Development is both a required prerequisite and a separate credit worth 1 to 6 points. The required densities are shown in Table 3.
Table 3 Urban densities as per LEED ND
| Project condition | Residential minimum | Nonresidential minimum |
| Meets LEED’s specified transit-access condition | 12 dwelling units/acre within transit walking distance; 7 outside it | FAR 0.80 within transit walking distance; FAR 0.50 outside it |
| All other projects | 7 dwelling units/acre | FAR 0.50 |
The BEAM Plus green building code sets requirements for sustainable sites. It obligates the developer and the consultant in charge to provide setbacks for the building and to preserve views to selected sections of ridgelines and peaks by maintaining a 20% building-free zone.
Who Sets Urban Density Requirements, and How Are They Generated?
Governments around the world take full responsibility for defining land for development. Identifying land means classifying it, that is, giving every part of it a specific function, such as residential, industrial, or open park. This process is called land zoning. Table 4 shows the objectives and disadvantages of land use zoning.
Table 4 Factors determining land use zoning, and land use zoning objectives and disadvantages
| Zoning objectives | Zoning disadvantages | Amount of land used determined |
| • Conserving the value of property • Assuring orderly community growth • Safeguarding the general public welfare | • Zoning restricts the supply of land uses and thereby prevents some demands from being satisfied. • Strong land use regulations that limit housing supply increase housing prices. • Zoning excludes persons and properties and is considered against the democratic freedom of living and against diversity. • Zoning imposes regulations that limit use, density, area, and height, considerably reducing the land available for development and causing much greater sprawl. | • Government regulations • Private market |
Once the land classification is complete, the authorities conduct market land price studies. Full land use modeling then takes place to define the development characteristics of each part of the land. At this stage of land use policy building, land developability must be assessed through four types of analysis: land suitability analysis, carrying capacity analysis, committed lands analysis, and market forecasts (Talib, 2017). Table 5 shows land suitability criteria for different uses.
Table 5 Land suitability criteria for different uses
| CRITERIA | LAND USE | ||
| Residential | Industrial | Public building | |
| • Suitable topography • Proximity to lakes and streams • Proximity to shopping centers, recreation areas, and cultural areas | The choice of an industrial location involves many factors, such as: • Availability of raw materials • Transportation • Location of markets • Climate • Water supply • Regulatory laws • Special inducements offered by the community • Electric power • Labor supply • Wage rates • Existing industries • The physical site • Services available • Tax structure | Central type that serves the whole community. • Located so as not to disrupt or interfere with the function of the business district or create unnecessary traffic congestion. • They may be located in the form of a buffer or transition between land uses • They may be located in groups and on sites not related to each other | |
Several types of software support land use modeling and density analysis. Table 6 describes the main ones.
Table 6 Software used for land use modeling and density analysis
| Analysis purpose | Software | Brief description |
| Spatial and land analysis | ArcGIS Pro; QGIS | GIS platforms used to map existing density, parcels, vacancy, and constraints, and to run suitability and buildable-land overlays. ArcGIS Pro is the common standard in government; QGIS is a free alternative. |
| Scenario planning and build-out | CommunityViz; ArcGIS Urban; UrbanFootprint; Envision Tomorrow | Scenario tools for testing low, medium, and high density options and calculating the maximum build-out that zoning would allow. |
| Growth and land use forecasting | UrbanSim; R or Python | Models that project population, housing demand, and land development over time, usually starting from census and regional forecasts. |
| Infrastructure capacity | InfoWater; SWMM; HEC-RAS | Engineering models for water network demand, stormwater runoff, and flood behavior under added density. |
| Traffic and transport | Synchro; VISSIM; TransCAD; Cube | Junction and traffic simulation, and regional travel demand modeling used for trip generation and traffic impact studies. |
| Financial feasibility | Excel; Argus | Pro forma and residual land value models that test whether a given density is viable for the developer. |
| 3D massing and visualization | SketchUp; Rhino and Grasshopper; Lumion; Twinmotion | Tools for modeling building envelopes, comparing different forms for the same floor area, and rendering them for review. |
| Public engagement | Social Pinpoint; Mentimeter; ArcGIS StoryMaps | Online platforms for surveys, mapping exercises, and presenting the plan to the public. |
Urban Density Against Professional Practice Ethics: UAE and US Examples
I have lived, witnessed, and worked within one of the largest mega developments in the world: the Business Bay development. Its development guidelines were prepared by international and local authority professionals. The Burj Khalifa commercial urban development zone stands as an urban density policy change example against all odds. The Ruler set the vision for the tallest tower in the world and for the city’s image to expand from this area. Developers could build to any height on any parcel, whether they owned the land or leased it. The result is a congested area of high-rise towers with very little distance between them, and a total neglect of transport network design requirements and public space. The development site is adjacent to four areas of different densities and building heights. Along Sheikh Zayed Road toward Abu Dhabi lies the Al Quoz industrial area. On the opposite side are Zabeel Park and Al Karama, with buildings of five stories. The adjacent Nad Al Hamar area is a residential villa area of two stories, and the Jumeirah Road residential area on the other side is also made up of two-story villas.
The contradiction lies not only in the zoning, building height, setbacks, parking requirements, and plot coverage, but also in the land price itself and in what the developer could do with the development. The contrast is striking between the relatively high land price of central Downtown Dubai and the moderate to lower land prices of the adjacent areas. It also reflects a neglect of the professional measures for proper zoning and land use modeling. It was a political decision, and it showed that political power can intervene and override all of the government’s urban policies on the density of a development. To date, the tower has not been fully occupied because of high rents. The tower itself also faced funding challenges: the government could not provide the developer with enough money to finance construction, so the then President of the UAE rescued the project and bought most of its shares to safeguard its success and completion. The tower now carries the name of that former president.
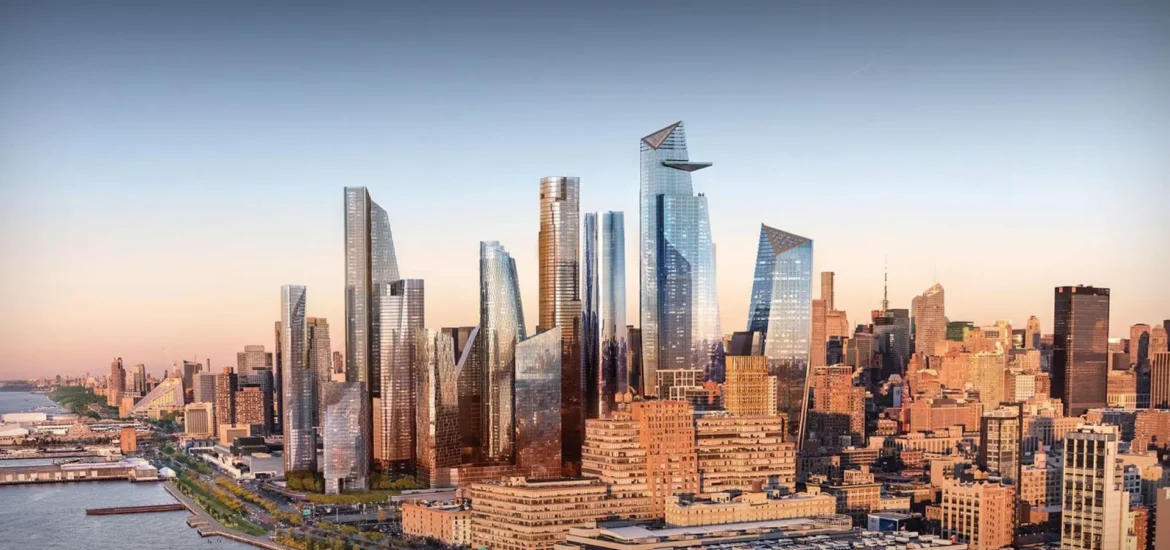
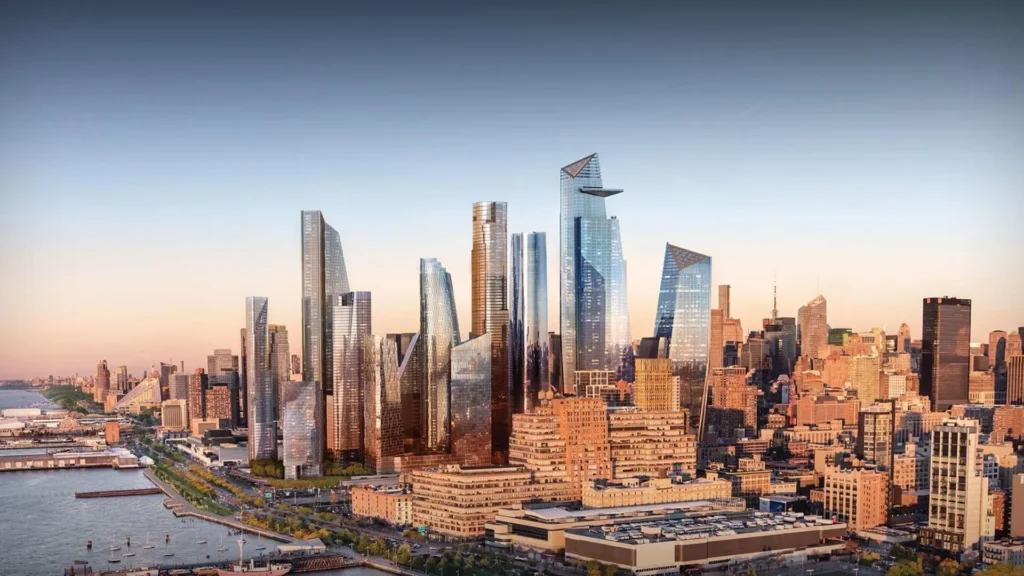
To balance the Dubai example, I bring a United States example of a high-end district that was also created through a government-led vision, but through a different path: Hudson Yards in New York City, built over the rail yards on Manhattan’s Far West Side. In 2005 the city launched its plan to transform the area into a high-density office, commercial, and residential district through rezoning, the extension of the 7 subway line, and a new park-lined boulevard (NYC Independent Budget Office, 2013).
Here the exception was written into the rules. The rezoning created a Special Hudson Yards District with six subdistricts and raised the permitted density from a floor area ratio (FAR) of 5 or 6 to FAR 15 and 19 (CityLand, n.d.). The land above the rail yard belongs to the MTA, the state transit agency, which ran a request for proposals for the air rights and awarded them to Related Companies (ENR, n.d.). Unlike the Dubai case, the density was not simply granted. A developer could exceed the base FAR by making a District Improvement Bonus payment that funds infrastructure in the area, and density could also be increased by including affordable housing in a residential project (Hudson Yards Development Corporation, n.d.; CityLand, n.d.).
The project still depended on public finance and public approval. The Hudson Yards Infrastructure Corporation was authorized to issue bonds to pay for the improvements, on the expectation that the rezoning and the subway extension would greatly increase the development potential of the land, but the revenue it collected fell short of expectations (NYC Independent Budget Office, 2013). The plan also went through the city’s formal public review before approval by the City Council, where the main concerns were affordable housing, density, transportation, condemnation, and jobs (CityLand, n.d.).
Comparing the two cases shows two ways of departing from the ordinary procedure of studying capacity first and then setting density (Table 7). In Dubai, the Ruler’s vision set the density first, and the professionals worked to make it succeed. In New York, the vision was also political, but the exception was made through a special district, paid for through bonus payments and bonds, and opened to public review. Between ordinary zoning, a special district with tradeable density, and a vision-led decision of authority, the professional question is no longer only how much density an area can take, but who decides, who pays for the capacity, and who is heard.
Table 7 Burj Khalifa (Dubai) and Hudson Yards (New York): two ways of setting density
| Burj Khalifa, Dubai | Hudson Yards, New York | |
| Who decided | The Ruler’s vision, with a state-linked master developer | City planning and City Council, with the state transit agency (MTA) owning the land |
| Process | Executive decision; the normal capacity analysis and land use modeling were bypassed | Formal public review and City Council approval |
| Density mechanism | Vision-led: no zoning cap on height, set by authority | Special district with a raised base density (FAR 5 or 6 raised to 15 and 19) plus purchasable bonuses |
| Public benefit | Not tied to the density granted; transport network and public space requirements were largely set aside | Bonus payments fund infrastructure; affordable housing bonus |
| Main constraints | Engineering, cost, and market demand | Politics, financing, and public objection |
| Main risk | Dependence on one decision-maker and on funding; the tower needed rescue financing | Slower, negotiated process; bond revenue fell short of expectations |
| Role of planners, developers, and designers | Mostly implementing a decision already made | Negotiating and testing density through the bonus and review process |
References
Angel, S., Lamson-Hall, P., et al. (2021). Anatomy of density: measurable factors that constitute urban density. doi.org.
Batty, M. (2009). Defining density. Environment and Planning B: Planning and Design.
Boudon, P., et al. (1981). High density housing. Architecture d’Aujourd’hui, 215.
Churchman, A. (1999). Disentangling the concept of density. Journal of Planning Literature.
CityLand. (n.d.). Hudson Yards applications approved; sent to Council. citylandnyc.org/hudson-yards-applications-approved-sent-to-council/
Dovey, K., & Pafka, E. (2013). The urban density assemblage: Modelling multiple measures. Urban Design International.
ENR. (n.d.). Manhattan’s Hudson Yards district takes off. enr.com/articles/298-manhattan-s-hudson-yards-district-takes-off
Hudson Yards Development Corporation. (n.d.). Rezoning. hydc.org/rezoning
NYC Independent Budget Office. (2013, April). Hudson Yards report. ibo.nyc.ny.us/iboreports/hudsonyards2013.html
Rapoport, A. (1975). Toward a redefinition of density. Environment and Behavior, 7(2).
Talib, H. (2017). The evolution of land policy in Central London between 1900–2015 [Dissertation].
[…] Urban sprawl has circled in the western world, even in academic research, for a long time. Various concepts emerged to support the birth of this idea. From Wright’s Broadacre City to the Garden City, they all wanted to move out of the city to the countryside. They wanted a peaceful mind, calm areas, beautiful views of the countryside and, definitely, car-oriented development. Here urban sprawl came into view. Urban sprawl is closely linked to changes in urban density in the city. The gentrification approach of shifting people also has a direct connection to urban sprawl. I have presented urban density in detail in my article Urban Density in Practice. […]
[…] feasible, the countryside park should meet various urban design requirements such as urban density (you can read my detailed article covering this topic). And from my experience in the field, this function does not fulfil the requirements because it […]