Introduction
The green belt is a term that students of architecture, urban design and planning meet early. It comes up in undergraduate planning courses, and anyone who works in an urban design or planning firm will come across it often.
My own experience was different. In my earlier professional career, I did not come across the term at all. I met it only when I started doing urban design and researching urban planning. I have also not seen any focus on the green belt in practice in the Middle East. The cities where I worked did not implement a green belt, and none exists around them. Governments approved urban development freely in all directions around the city where I worked.
This article looks at the green belt through practice examples. It covers its origin, its development, and its outcomes, meaning how much it benefited the cities that implemented it. The main examples come from European cities, and a second example comes from the Middle East: Baghdad.
Garden Cities of To-morrow and the green belt idea
The green belt idea is often traced to Ebenezer Howard’s garden city movement, so I went back to his book, Garden Cities of To-morrow. My reading is that the book does not describe a green belt in the sense planners use the term today.
Howard writes about moving people out of the dense, industrial city to new towns in the countryside. We now call this idea satellite towns. In his diagrams a town of radial streets sits at the centre, with industry, warehouses and factories on its boundary and a loop of railway around the town. The surrounding land does appear in the scheme, but as an agricultural estate that feeds the town, brings in rent and keeps the town to a fixed size. It is not a barrier designed to stop a growing city from spreading, which is what a modern green belt is for. The book also does not treat sport, infrastructure engineering, urban growth or economics in the way a planning text would today.
The idea also contains contradictions. The garden city tradition is associated with a density of about 12 houses to the acre, a figure linked most closely to Raymond Unwin and Barry Parker’s plan for Letchworth. A density like that is, in planning terms, low-density development, which is exactly what urban sprawl describes. By encouraging low-density development on the edge of cities, the garden city idea works against the aim of the green belt, which is to restrain sprawl. A reader who goes through Garden Cities of To-morrow in detail will find more tensions of this kind.
Benefits of green belts for cities
Three research papers show that green belts deliver a broad range of benefits: urban growth containment, environmental protection and ecosystem services, and public health, aesthetic and social advantages. Each paper looks at these benefits from a different angle.
1. Growth management and anti-sprawl benefits (Pourtaherian & Jaeger, 2022)
This empirical study of 60 European cities shows the modern containment and land-use benefits of regional greenbelts.
- Mitigating and reversing sprawl. Greenbelts reduce and slow urban sprawl. Between 2006 and 2015, 90% of the greenbelt cities studied reduced their sprawl.
- Driving densification. The main mechanism is a significant reduction in land uptake per person (LUP). Cities use their existing built-up areas more efficiently instead of expanding onto undeveloped land.
- Enforcing a boundary to expansion. A greenbelt is a firm physical barrier around an urban region that prevents low-density, dispersed expansion onto rural land.
- Fostering compact green cities. Greenbelts supply an essential share of urban ecosystem services and support smart growth strategies for compact, sustainable cities.
2. Multifunctional infrastructure and ecological benefits (Aguado, Barrutia & Echebarria, 2017)
This European synthesis examines how greenbelts have moved from simple physical growth boundaries to multifunctional green infrastructure.
- Preserving farmland and natural peri-urban space. Greenbelts protect vulnerable city-edge areas, keep high-quality agricultural land and prevent habitat fragmentation.
- Promoting sustainable, compact cities. By curbing sprawl they encourage compact urban forms that support walking, more efficient use of resources and equitable access to public services.
- Climate action and environmental protection. They provide ecosystem services, help with climate change mitigation, reduce hazards such as fires and floods, and safeguard local water quality.
- Health, recreation and social integration. They offer accessible recreation and natural areas close to urban populations, which improves physical and mental health. They can also support local agriculture, environmental education and community programmes.
- Biodiversity and ecological connectivity. They link city spaces to regional natural networks, restore degraded land and strengthen ecological resilience.
3. Environmental health and civic benefits (Slukan Altić, 2012)
This historical study of Zagreb’s 19th-century town planning shows the internal buffer and health functions of green park rings.
- Buffering noise and pollution. Zagreb’s 1865 southern belt along the railway, realised largely as the Botanical Gardens, and the 1887 Green Horseshoe (Zelena potkova) were designed to shield residential areas from smoke, air pollution and train and industrial noise.
- Protecting public health and raising living standards. Planned green space in a rapidly industrialising city raised hygiene and health conditions.
- Aesthetic quality and civic identity. Park systems of the Gartenplatz and Schmuckplatz type brought natural landscape into the urban fabric and created public squares and promenades that gave the city a distinct identity.
Note that these Zagreb belts are internal buffers inside the city. They are not regional greenbelts that contain outward sprawl, and the paper does not describe one.
What the research measured: benefits realised in the sample cities
The Pourtaherian and Jaeger paper (Landscape and Urban Planning, 2022) treats the benefit of a greenbelt narrowly: its ability to curb urban sprawl. It compares 60 European cities, 30 with greenbelts and 30 without, between 2006 and 2015. It scores them on Weighted Urban Proliferation (WUP), Weighted Sprawl per Capita (WSPC) and land uptake per person (LUP). So when the paper speaks of benefits realised, it means measured reductions in sprawl and the densification behind them. It does not mean recreation, biodiversity or land values. Ecosystem services are mentioned in passing but not quantified for any city.
Headline result
- Most greenbelt cities reduced sprawl. In 27 of the 30 greenbelt cities (90%) sprawl fell, against only 36.7% to 43.0% of the control cities.
- Per-capita sprawl moved in opposite directions. It fell by 27.3% on average in greenbelt cities and rose by 24.2% in cities without one.
- Densification was the mechanism. The main driver was a reduction in land uptake per person, not simply holding a hard edge.
Large and very large cities
Greenbelts worked best here. Sprawl decreased in all 8 large greenbelt cities: Rome, Greater Manchester, Vienna, Budapest, Stockholm, Munich, Brussels and Cologne. Bigger cities under more growth pressure densified more behind the belt. Medium-sized cities with greenbelts also had far lower per-capita sprawl than medium-sized cities without one: 63% lower in 2006 and 73% lower in 2015.
Münster
The paper singles out Münster as a case where the greenbelt is called a green ring locally but still fits the paper’s definition and works as one. It is used to show that naming varies across countries.
Cities without a greenbelt that still reduced sprawl
The paper notes that a few cities without a greenbelt achieved similar results through other tools.
- Leipzig. The Grüner Ring Leipzig, founded in 1996, is a voluntary association of more than 20 municipalities. It works as a green-wedge or greenway development boundary and gave the region a locational advantage. The authors recommend this approach where a full greenbelt is not spatially feasible.
- Antwerp and Lincoln. Both showed notable decreases in LUP, housing more people and jobs in the same footprint. Their large absolute decreases pulled down the average of the whole non-greenbelt group.
Benefits that did not fully materialise
The paper contrasts its own city-scale findings with Xie et al. (2020), who studied Frankfurt, London and Seoul. In Frankfurt and London, sprawl decreased in the inner city, inside the belt, but increased in the outer ring within a 40 km buffer. In Seoul, sprawl rose both inside and, much more, outside the belt. That is leapfrogging, and the greenbelt failed at that wider scale.
Pourtaherian and Jaeger argue this is a question of scale rather than failure. At the proper city scale their own data show no leapfrogging, and expecting a Frankfurt belt to control growth in a distant town such as Darmstadt is unreasonable. They also cite the German regional greenbelts around Düsseldorf, Hanover, Mittelhessen and Stuttgart (Siedentop et al., 2016), which were effective at the regional scale. And they cite Zurich, which has no greenbelt but stayed less sprawled than Montreal and Quebec City thanks to strong transit and planning, which greenbelts could complement.
Bottom line
In roughly nine of ten cities, greenbelts slowed or reversed sprawl, mostly by forcing densification and lowering land uptake per person, with the strongest effect in large cities. Broader green benefits are asserted but not measured. And the belt’s benefit is bounded by scale: it holds inside the city, but it can displace growth to the region unless neighbouring municipalities cooperate.
Why the green belt idea was not more widely implemented in European cities
A caveat first: the Pourtaherian and Jaeger paper does not analyse why greenbelts spread unevenly across Europe. Its focus is effectiveness, not adoption. It treats greenbelts as concentrated in a few countries, particularly Germany and the UK, rather than as widely absent, and most of the world’s greenbelts are in Europe. It offers only scattered reasons that bear on limited or uneven uptake.
- 1. The policy’s effectiveness is disputed. The paper opens with this controversy. Opponents argue that greenbelts push development further out instead of preventing it. Anas et al. (1998) expect them to spawn exurban development beyond the belt, and Han (2019) argues that restricting land supply raises development pressure inside the greenbelt. A policy whose basic value is contested is harder to justify.
- 2. Leapfrogging needs regional cooperation. A greenbelt works only if the surrounding municipalities also restrain growth. Otherwise development jumps the belt into neighbouring jurisdictions. Coordinating many independent local governments around one shared boundary is an institutional hurdle, not a technical one.
- 3. Planning capacity and resources. Growth-management policies are applied more often in larger municipalities because of their higher planning capacity, while smaller ones may lack financial and administrative resources (Rudolf et al., 2018). The paper makes the same point about the United States, where many local governments with low planning capacity keep greenbelt policy uncommon.
- 4. Definitions differ across countries. The exact criteria of a greenbelt are not always clear and can cause confusion (Macdonald et al., 2021). The paper’s own example is Münster, whose belt is called a green ring.
- 5. Spatial feasibility. In some cities a greenbelt is not possible because of the existing arrangement of built-up areas. The paper then recommends greenways or green wedges, as in Leipzig.
- 6. Credible alternatives exist. Greenbelts are one tool among others: public acquisition, regulation, quality-oriented measures, market incentives, information-based social learning, and urban growth boundaries and urban service boundaries. Antwerp, Lincoln and Leipzig achieved comparable sprawl reductions through such tools.
Taken together, the paper frames limited or uneven adoption as a mix of contested effectiveness, the need for regional coordination, weaker planning capacity in smaller municipalities, inconsistent definitions, spatial constraints and alternative tools. It does not systematically explain national differences in uptake. That would need the cross-national policy study the authors flag as future work.
Alternative tools to mitigate urban sprawl
The five-way classification comes from Hersperger et al. (2020), building on Bengston et al. (2004) and Rudolf et al. (2018). The definitions are my short explanations, apart from the UGB and service boundary points, which are the paper’s.
- Public acquisition: The state buys land, or development rights, to keep it open. It is very secure but expensive, which limits how much land can be covered.
- Regulation (planning-based): Zoning, building bans, density limits and permit rules. The paper calls greenbelts one of the most important instruments of this type, so a greenbelt is really a form of regulation.
- Quality-oriented measures: Design and quality standards that make compact, infill or brownfield development attractive and acceptable, such as green-infrastructure requirements or quality criteria for new development. This is the least precisely defined of the five.
- Incentives (market-based): Taxes, impact fees, subsidies and transferable development rights that make developing inside the built-up area cheaper than building on its edge.
- Social learning (information-based): Awareness, participation and voluntary cooperation instead of legal limits. The paper’s example is the Grüner Ring Leipzig, a voluntary working group of over 20 municipalities founded in 1996. It ties Leipzig’s strong sprawl reduction to this kind of measure.
- Urban growth boundaries: The paper says a greenbelt designates a physical area, whereas a boundary is a line that separates urban from rural zones. In four Swiss municipalities, such boundaries kept over 70% of development inside the designated building zones and lowered land use per person.
- Urban service boundaries: The line beyond which infrastructure and public services are not provided, so development outside it is restricted.
The research table: which cities have a green belt, and since when
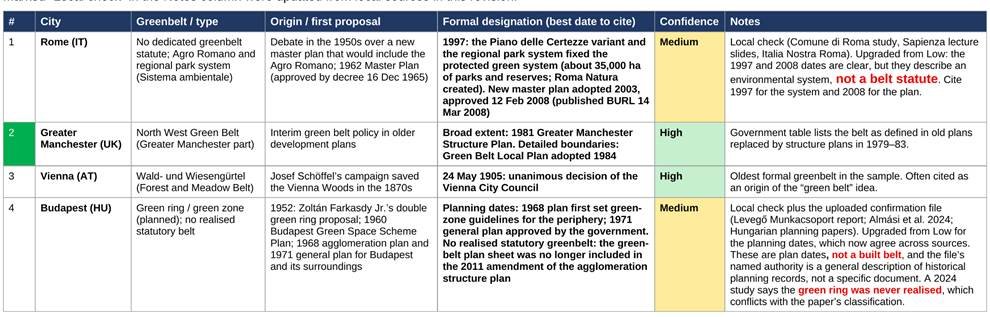
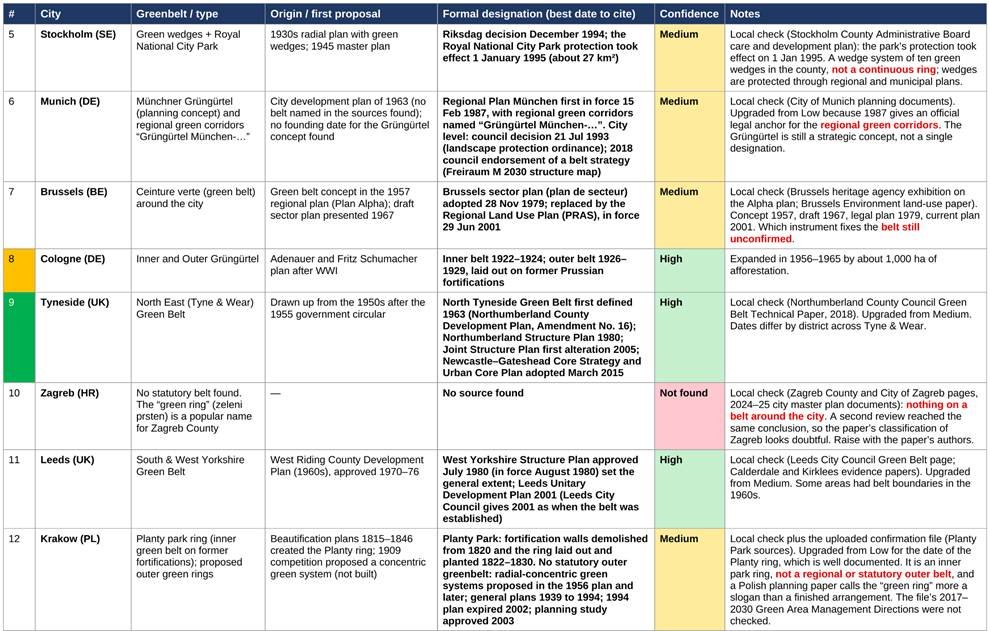
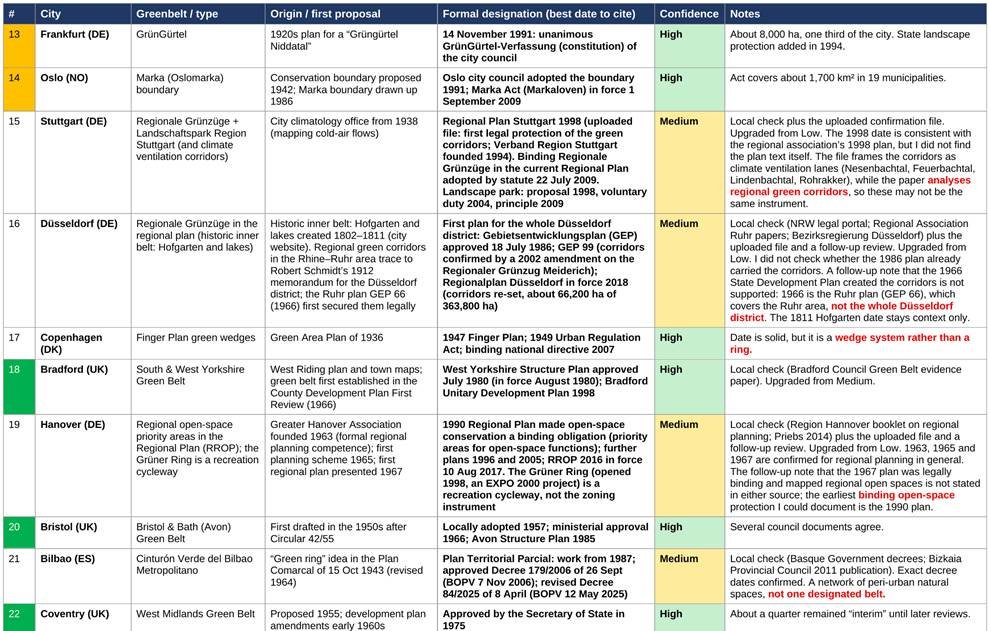
The Pourtaherian and Jaeger study covers 60 cities in 13 countries and sorts them into 30 greenbelt cities and 30 controls without one. The paper does not give an implementation date for any city and names this as a limitation. To close the gap, I searched city, regional and planning-office sources for each of the 30 greenbelt cities. The table on the next page is the result.
The 30 greenbelt cities are not spread evenly. The UK has 13 cities in the sample, 11 with a greenbelt and 2 without (Glasgow and Lincoln). Germany has 14 cities and 7 are classed as greenbelt cities: Cologne, Frankfurt, Munich, Stuttgart, Düsseldorf, Hanover and Münster. Of these, Cologne and Frankfurt have the clearest ring-type belts; the others are regional green corridors or informal green-ring concepts. In Norway the greenbelt city is the capital, Oslo. In France it is Rennes. The remaining greenbelt cities are in Italy, Spain, Belgium, Poland, Sweden, Austria, Croatia, Hungary and Denmark.
Dates were found with different levels of confidence. A clear formal date was found for 18 cities (High), a composite or less authoritative date for 11 (Medium), and nothing for 1 (Not found), which is Zagreb.
Table: greenbelt cities and when their greenbelts were established
Cities follow the order of the paper’s Table 1, from largest to smallest by 2015 population. Colour shows confidence: green High, yellow Medium, red Not found. Updated 30 October 2026.
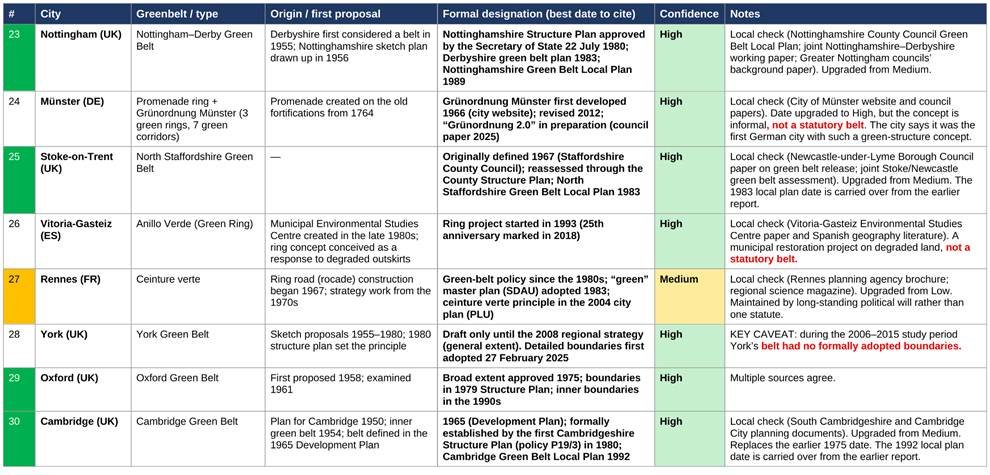
What the dates show
- Dates span 1905 to 2025. Vienna’s forest and meadow belt (1905) is the oldest. York’s detailed boundaries (2025) are the newest. Most UK belts were proposed in the 1950s and formally approved between 1963 and 1984.
- “Established” has no single meaning. For each city the table separates the first proposal from the formal designation, and the best date to cite is the formal one.
- The sample mixes different kinds of belt. There are statutory rings in England (Oxford, Cambridge, Bristol and others), historic fortification rings turned into parks (Cologne, Vienna, Münster), wedge systems (Copenhagen, Stockholm), and regional green corridors in German regional plans (Stuttgart, Düsseldorf, Hanover, Munich). A single comparison of age across these would mix very different instruments.
- Two classification concerns remain. York had no adopted green belt boundaries until February 2025, which is after the 2006–2015 study period. A 2024 study says Budapest’s green ring was never realised. The paper counts both cities as greenbelt cities. For Zagreb, local sources found no belt, and the “green ring” there is a popular name for the surrounding county. Slukan Altić (2012) documents only an internal 19th-century green belt and park ring.
This matters for the paper’s result. The paper recommends adding greenbelt age, enforcement strength, closedness and width in future research. The dates here show that age varies widely: a belt formalised in 1905 and one formalised in 1991 or 2025 were treated as equal in the 2006–2015 comparison.
Dates come from web sources of mixed quality. High rows rest mostly on council or regional planning documents. Treat the Medium and Not found rows as leads to check, not settled facts. The best route to close the gaps is the paper’s supplementary Appendix A and the city planning offices the authors say they contacted for greenbelt maps.
Baghdad: a green belt in the Middle East
A planning professional’s account of the Baghdad green belt gives a Middle Eastern case to set beside the European cities.
Baghdad is the capital of Iraq. At the time the green belt was implemented the city was in the period of the monarchy, and its population was, in this account, two to three million. The regime invited the Greek planner Doxiadis to prepare a master plan. It included infrastructure, highways and internal roads. Its most important part was new housing for low-income residents on the city boundary, inside the forest and the already built-up area around the city.
The green belt became the focus of the plan, and the professional literature and practice praised its benefits for the city. It was planted with trees eight to nine metres high, such as date palms, and with orange and lemon trees about five metres high. It offered a green space that was meant to stop the city from extending horizontally into neighbouring cities.
After the collapse of the regime in 2003, most of the green belt was converted into housing. This happened without official approval from the government and was often based only on a court order. The city then faced several problems. Odours came from waste-recycling plants at the city edge, and dust and dirt blew in from industrial areas in neighbouring cities and the centre of Baghdad.
The purpose of a green belt is to prevent urban sprawl. When it was implemented, the population was about two to three million. In recent years it has reached about 12 million, yet the city could still absorb more people because of the low-rise development that already exists. Higher-density housing inside the city could take in a population of more than 12 million. The green belt did not stop development from extending to other cities, largely because land there was cheap. In the end it did not achieve its goals, and sprawl extended to other cities even though the city itself could have accommodated the growth.
Conclusion
The European evidence shows that a green belt can reduce sprawl, mainly by pushing cities to densify, and that its effect is strongest in large cities. It also shows the limits: the effect depends on scale, on regional cooperation, on planning capacity and on what the term actually means in each country. The dates in the research table show that the belts are of very different ages and kinds. Baghdad shows the other side. A belt that is not enforced, and that sits beside cheap land in neighbouring cities, does not stop sprawl.
Sources
- Pourtaherian, P. & Jaeger, J.A.G. (2022). Greenbelts at mitigating urban sprawl: A complex adaptive system perspective. Landscape and Urban Planning, 227, 104532.
- Slukan Altić, M. (2012). Town planning of Zagreb 1862–1923 as a part of European cultural circle. Ekonomska i ekohistorija, 8, 100–107.
- Aguado, I., Barrutia, J. M., & Echebarria, C. (2017). Anillos verdes: algunas experiencias europeas. BAGE: Boletín de la Asociación Española de Geografía, 73, 33–60. https://doi.org/10.21138/BAGE.2408
- Almási et al. (2024). The Green Rings of Budapest. Architektúra & Urbanizmus, 58.
- Howard, E. (1902). Garden Cities of To-morrow.
- Dates in the research table come from council and regional planning documents, parliamentary records (UK Hansard, 1987 and 1988), city and state planning offices, and the sources listed in the companion table document of 29 October 2026.